bstats-graph-api
Generate bStats chart images on the fly — embed live plugin stats in any README.
Examples


How to use
Find the available chart IDs for any plugin:
GET /v1/plugins/{plugin_id}/chartsEmbed a chart in your README:
Pick a theme, then override individual parameters as needed:
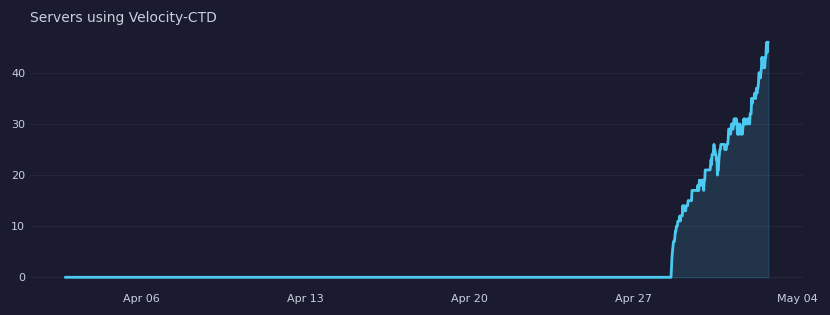
?theme=green&width=600&height=200
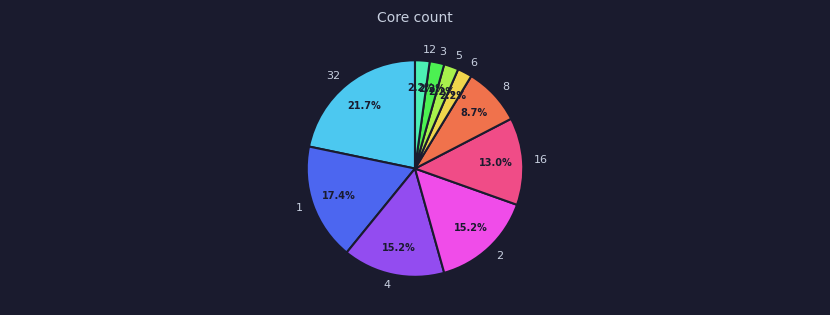
?theme=purple&max_elements=336
?theme=light&line_color=dc2626Parameters
dark
theme=dark
Default. Navy background, cyan line.
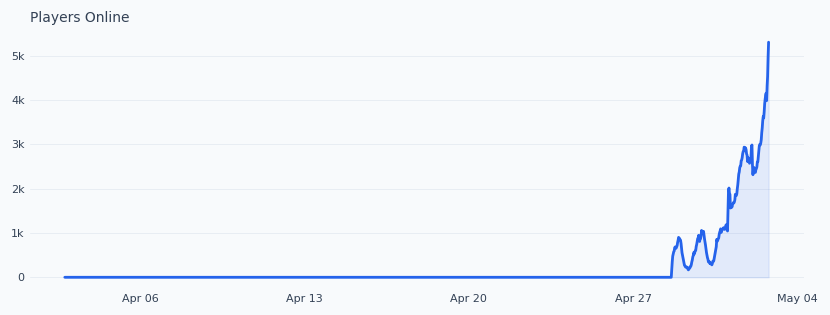
light
theme=light
White background, blue line.
purple
theme=purple
Deep purple background, purple line.
green
theme=green
Dark green background, emerald line.
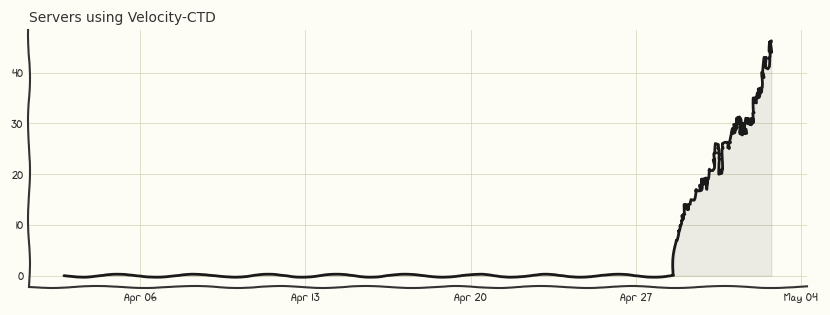
sketch
theme=sketch
Paper/hand-drawn style with xkcd font and wobbly lines.
| Parameter | Default | Limits | Description |
|---|---|---|---|
| theme | dark | dark, light, purple, green, sketch | Color preset — overridable by any color param below |
| width | 830 | 200–2000 | Image width in px |
| height | 315 | 100–1000 | Image height in px |
| max_elements | 1440 | 2–17520 | Data points to fetch (~30 days at default) |
| bg_color | from theme | 6-char hex | Background color |
| line_color | from theme | 6-char hex | Line color (also base color for pie palettes) |
| text_color | from theme | 6-char hex | Axis label color |
| grid_color | from theme | 6-char hex | Grid line color |
| fill | true | bool | Fill area under line |
| fill_alpha | from theme | 0.0–1.0 | Fill opacity |
| line_width | 2.0 | 0.5–5.0 | Line thickness (line charts only) |
| title | from bStats | max 100 chars | Override the chart title |